Deep Neural Networks Under Stress
\\((1)\\) Sorbonne Universités, UPMC Univ Paris 06, CNRS, LIP6 UMR 7606, 4 place Jussieu 75005 Paris
\\((2)\\) University of Campinas, RECOD Lab -- DCA/FEEC/UNICAMP, Campinas, Brazil
Abstract: In recent years, deep architectures have been used for transfer learning with state-of-the-art performance in many datasets. The properties of their features remain, however, largely unstudied under the transfer perspective. In this work, we present an extensive analysis of the resiliency of feature vectors extracted from deep models, with special focus on the trade-off between performance and compression rate. By introducing perturbations to image descriptions extracted from a deep convolutional neural network, we change their precision and number of dimensions, measuring how it affects the final score. We show that deep features are more robust to these disturbances when compared to classical approaches, achieving a compression rate of 98.4%, while losing only 0.88% of their original score for Pascal VOC 2007.
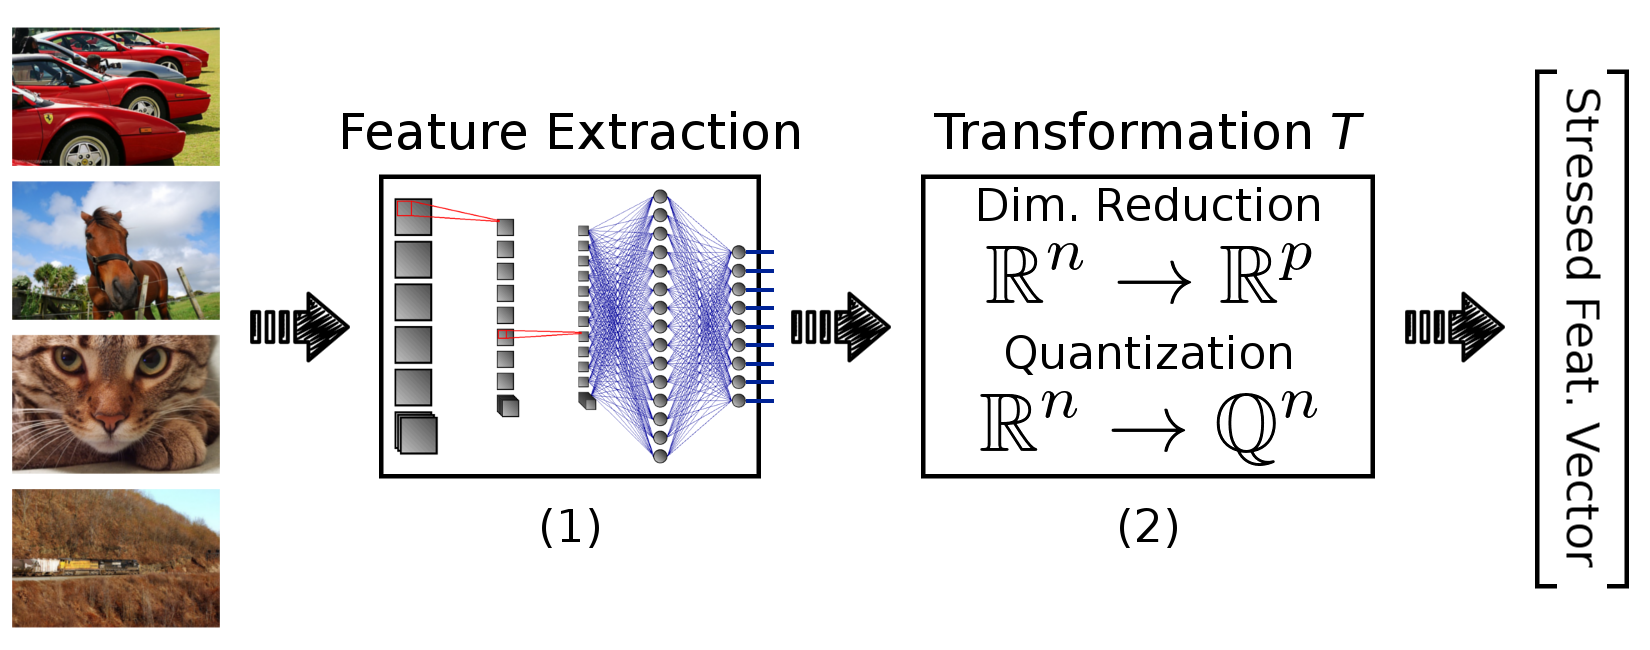
Figure 1: Overview of our framework. Input images are converted to stressed feature vectors by: (1) extracting descriptions using a pre-trained deep network, (2) transforming/stressing the feature vectors by reducing their precision or their number of dimensions.
Files:
- Source Code. Deep Neural Networks Under Stress. [ Download on GitHub ]
- Detailed Results. Deep Neural Networks Under Stress. [ Download : 5kB ]
- Supplementary Results. Deep Neural Networks Under Stress. [ Download : 94kB ]
Images from the paper:
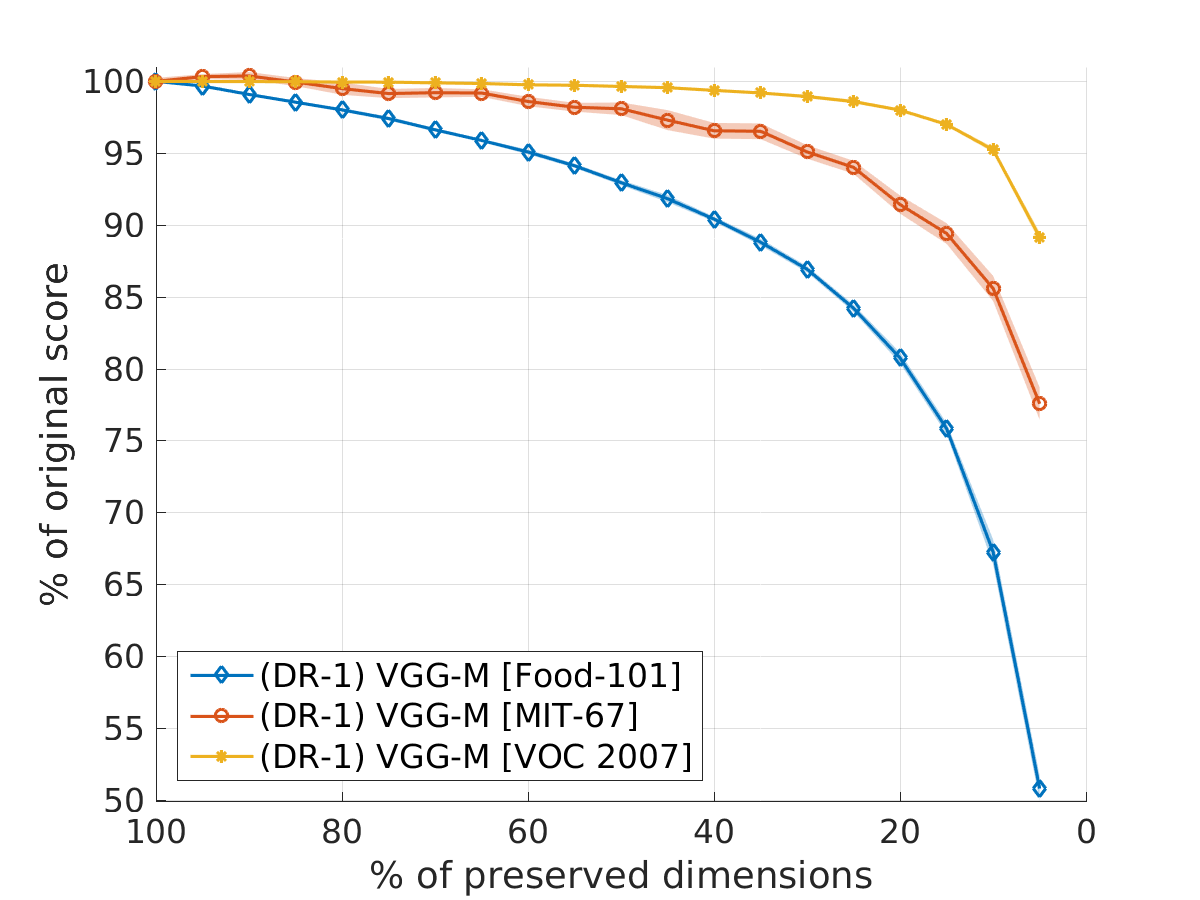
Figure 2: Results for dimensionality reduction (DR) on VOC~2007 with standard deviation (shaded regions around the lines). In the horizontal axis, each value indicates the percentage of the original dimensions that is kept, while the corresponding score, with the respect to the initial one, is shown vertically. On the right side of the figure, we show the number of dimensions for each model, when only 5% of their initial size is preserved.

Figure 3: Results for dimensionality reduction (DR) with VGG-M for Food-101, MIT-67 and VOC 2007. The datasets have 101, 67 and 20 classes, respectively.
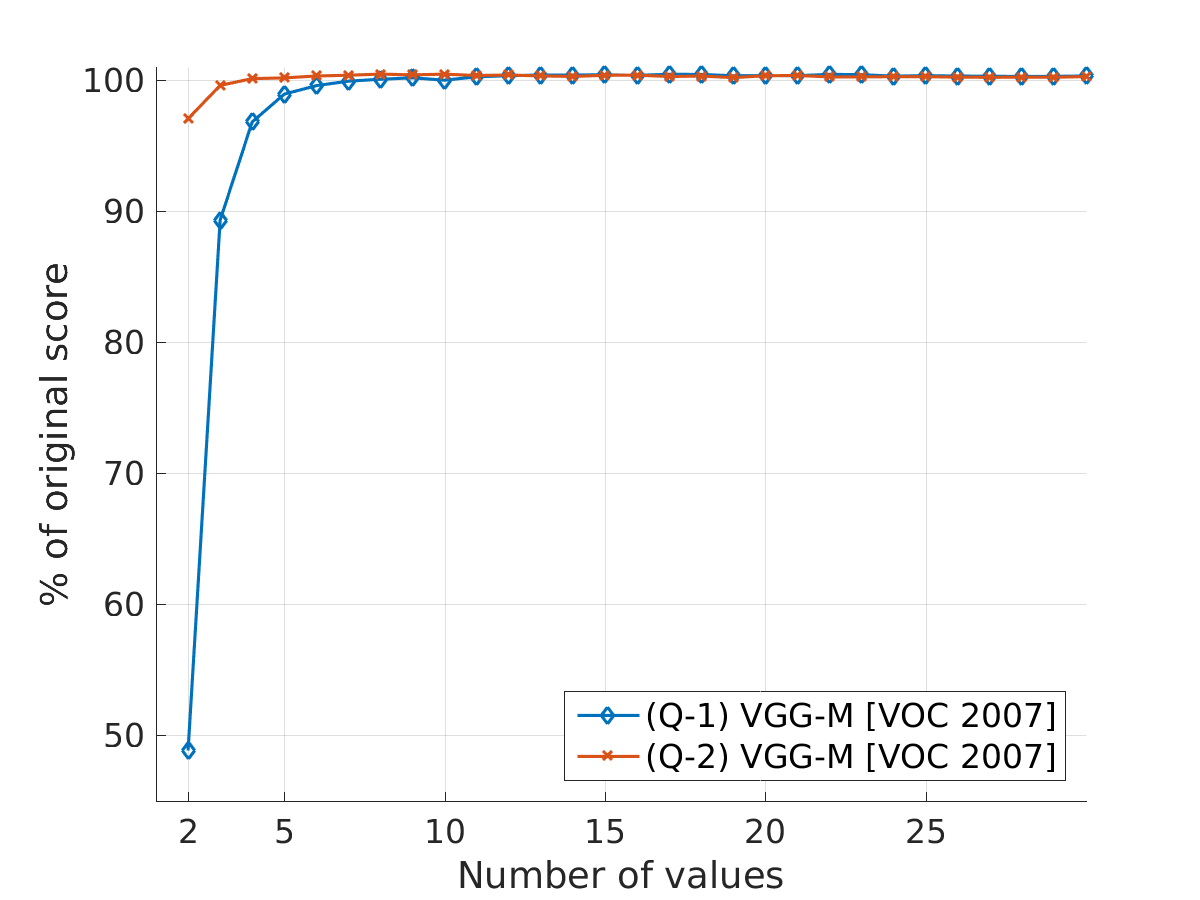
Figure 4: Results for quantization of features on the base setup (VGG-M and Pascal VOC 2007). We can keep vanilla performance while reducing the feature vectors from \\(32*m_i\\) to \\(\lceil\log_2 7\rceil*m_i\\) and \\(\lceil \log_2 4\rceil * m_i\\) bits, using Q-1 and Q-2, respectively.

Figure 5: Results for feature compression (FC). We reduce the number of dimensions and the precision of the feature vectors at the same time. The circle, square and cross, mark configurations with compression rates of 99.1%, 98.4% and 96.9%, respectively, while maintaining 97.8%, 99.1% and 99.6% of the original score.